Visualization
visualization: Some methods for visualization
This subpackage contains some stuff for visualizations. Documentation is available in the docstrings and online here.
Methods
oppy.visualization.getFigure module
Get Figure.
This Module contains the function newFigure.
With this method you can automatically arrange several plots next to each other on your screen without them being displayed on top of each other. It does not matter where you have your taskbar.
If you use an IDE please note: This method does not work if you have inline plots enabled. Also, this method is currently not available for Mac.
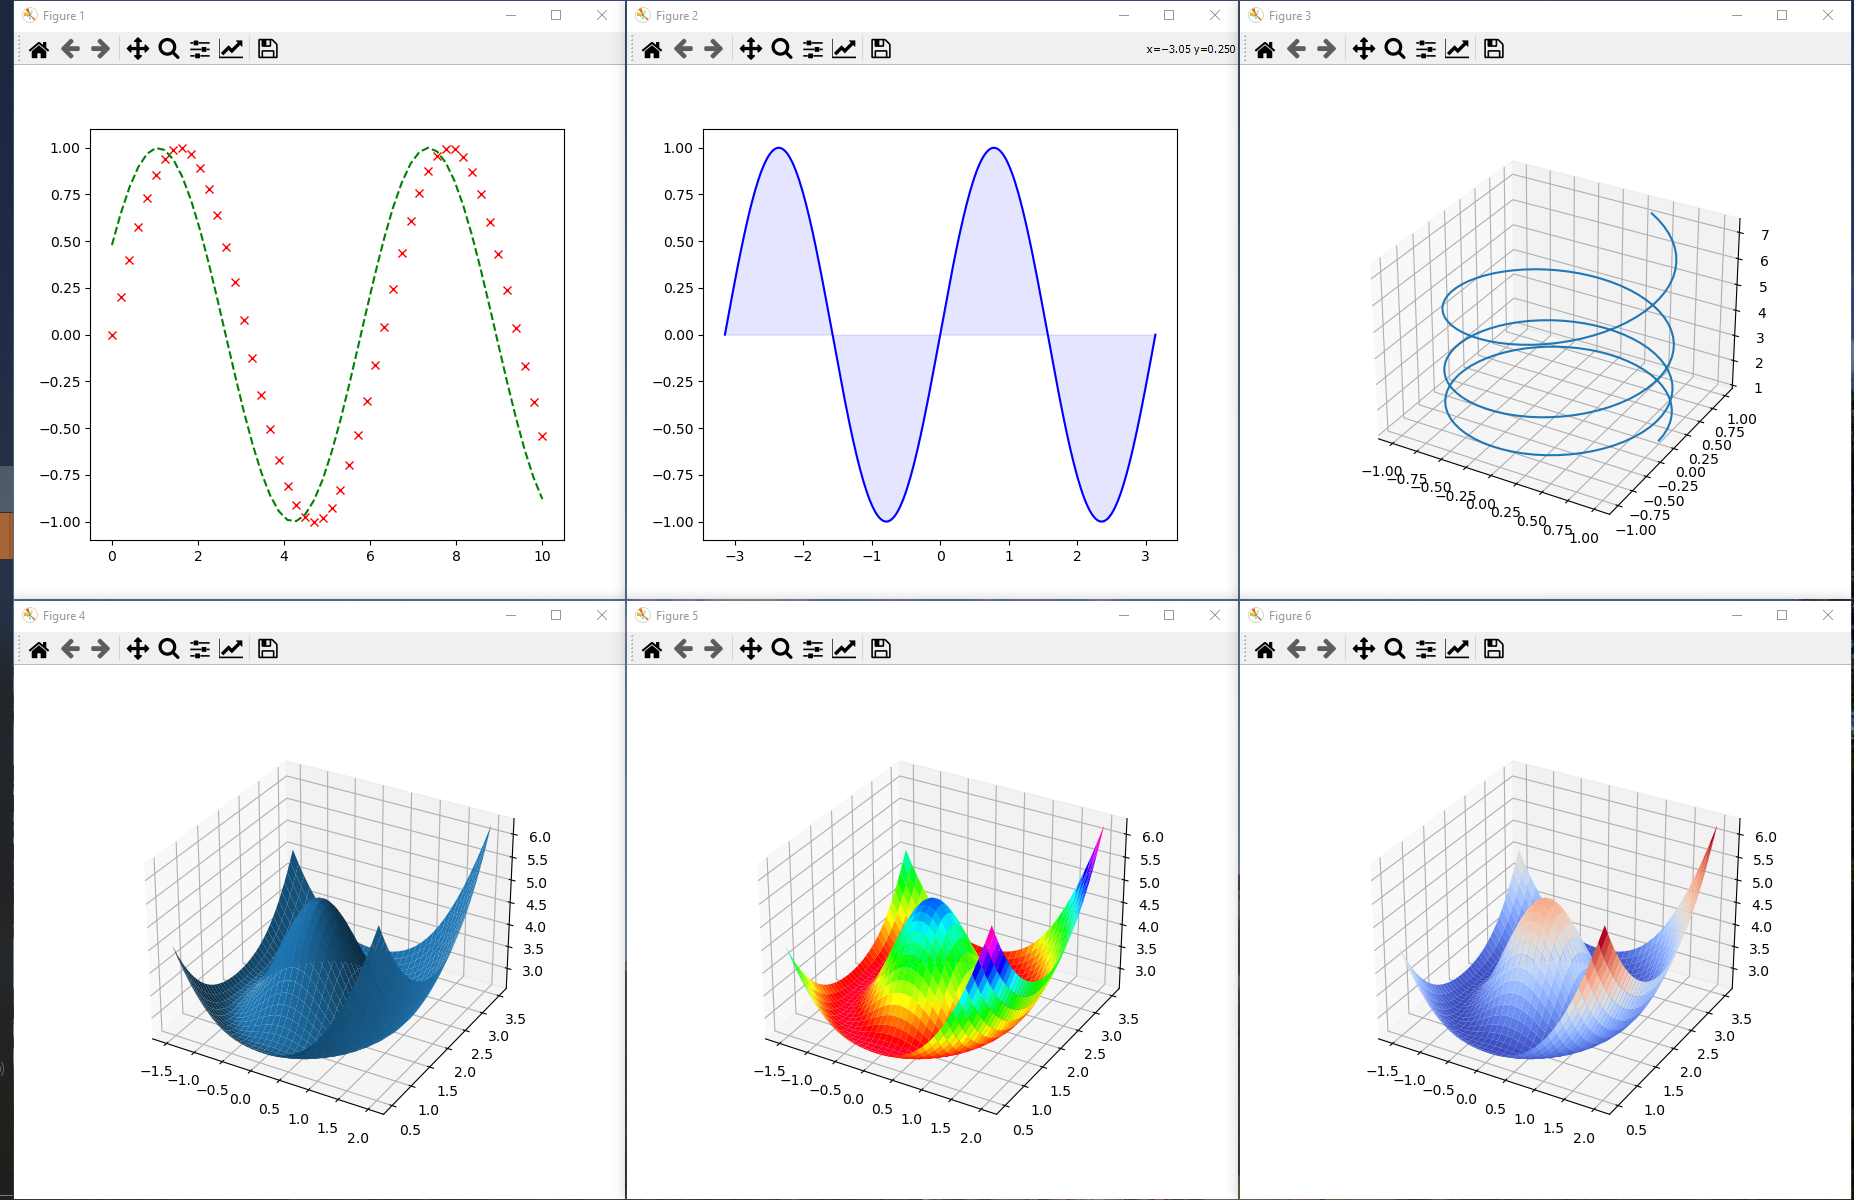
Up to six images can be displayed on the screen simultaneously like in the following picture.
-
oppy.visualization.getFigure.newFigure() -
newFigure.
This method divide your screen into six free spaces and plot your matplotlib figures at this different places.
Returns: hfig Return type: matplotlib.figureYour current figure window.Examples
Imprt numpy and matplotlib to plot your figure.
>>> import numpy as np
>>> import matplotlib.pyplot as plt
>>> from oppy.visualization.getFigure import newFigure
Create a linespace and the coresponding values of the evaluated function. Here we plot the sinus function.
>>> x = np.linspace(0, 2*np.pi, 50)
>>> y = np.sin(x)
Now create a newFigure using oppy, add an axis as matplotlib sugest as best practice and go ahead as usual.
>>> fig = newFigure()
>>> ax = fig.add_subplot()
>>> ax.plot(x, y)
>>> plt.show()
Your new Figure will be arranged on the screen like in a 2x3 Matrix.